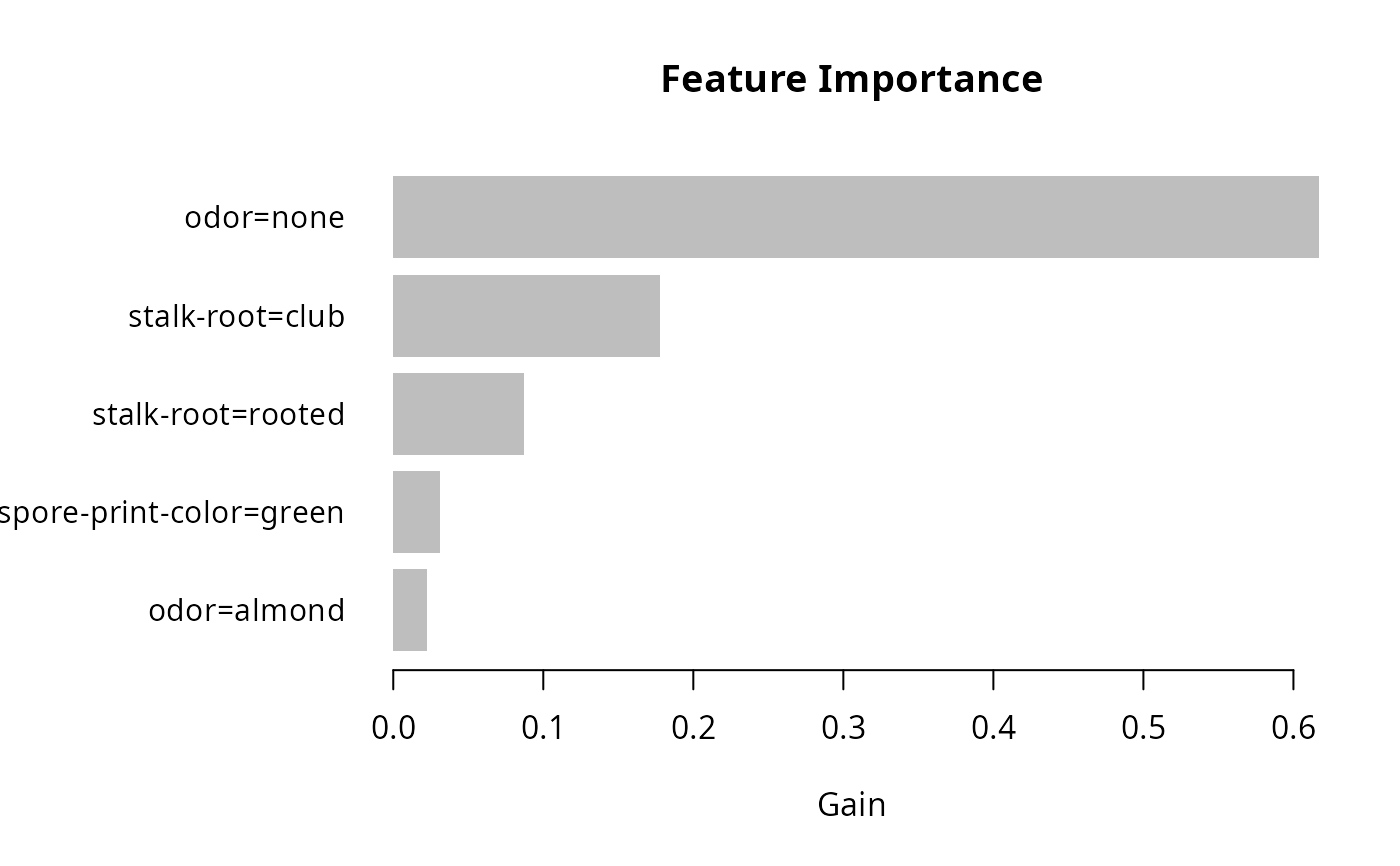
将预先计算的特征重要性(Gain、Cover 和 Frequency)绘制为条形图。
lgb.plot.importance(
  tree_imp,
  top_n = 10L,
  measure = "Gain",
  left_margin = 10L,
  cex = NULL
)
参数
- tree_imp
一个由
lgb.importance返回的data.table。- top_n
包含在图表中的顶部特征的最大数量。
- measure
要绘制的重要性度量名称,可以是 "Gain", "Cover" 或 "Frequency"。
- left_margin
(基础 R 条形图) 允许调整左边距大小以适应特征名称。
- cex
(基础 R 条形图) 作为
cex.names参数传递给barplot。设置一个小于 1.0 的数字会使条形图标签比 R 默认值小,大于 1.0 的值会使其变大。
返回值
lgb.plot.importance 函数创建一个 barplot,并静默返回一个已处理的 data.table,其中包含按定义重要性排序的 top_n 个特征。
详情
该图将每个特征表示为一条水平条,其长度与特征的定义重要性成比例。特征按重要性降序排列显示。
示例
# \donttest{
data(agaricus.train, package = "lightgbm")
train <- agaricus.train
dtrain <- lgb.Dataset(train$data, label = train$label)

params <- list(
    objective = "binary"
    , learning_rate = 0.1
    , min_data_in_leaf = 1L
    , min_sum_hessian_in_leaf = 1.0
    , num_threads = 2L
)

model <- lgb.train(
    params = params
    , data = dtrain
    , nrounds = 5L
)
#> [LightGBM] [Info] Number of positive: 3140, number of negative: 3373
#> [LightGBM] [Info] Auto-choosing row-wise multi-threading, the overhead of testing was 0.000747 seconds.
#> You can set `force_row_wise=true` to remove the overhead.
#> And if memory is not enough, you can set `force_col_wise=true`.
#> [LightGBM] [Info] Total Bins 232
#> [LightGBM] [Info] Number of data points in the train set: 6513, number of used features: 116
#> [LightGBM] [Info] [binary:BoostFromScore]: pavg=0.482113 -> initscore=-0.071580
#> [LightGBM] [Info] Start training from score -0.071580
#> [LightGBM] [Warning] No further splits with positive gain, best gain: -inf
#> [LightGBM] [Warning] No further splits with positive gain, best gain: -inf
#> [LightGBM] [Warning] No further splits with positive gain, best gain: -inf
#> [LightGBM] [Warning] No further splits with positive gain, best gain: -inf
#> [LightGBM] [Warning] No further splits with positive gain, best gain: -inf

tree_imp <- lgb.importance(model, percentage = TRUE)
lgb.plot.importance(tree_imp, top_n = 5L, measure = "Gain")

# }
# }